Journal · Cartography
A rift nobody wanted to find
Marie Tharp plotted a valley running down the center of the Atlantic seafloor. Her colleague called it girl talk. It was the first clear outline of plate tectonics, and it was visible only because someone drew the numbers instead of tabulating them.
The data was not secret and it was not new. Ships had been dragging echo sounders across the Atlantic for years, pinging the bottom and recording the travel time of the returning sound. What existed by 1950 was a large quantity of depth readings along ships’ tracks: columns of numbers, each one a point on a line across an ocean nobody had seen.
Marie Tharp’s job at Columbia’s Lamont Geological Observatory was to turn those columns into profiles — to draw the cross-section of the seafloor that each crossing implied. She had degrees in English and music before she took a wartime opening into geology, and then a master’s in geology and a spell in the oil industry, which had taught her that women were welcome to interpret data and not to collect it. At Lamont she was barred from the research vessels. Bruce Heezen went to sea and came back with soundings; Tharp stayed ashore and drew them. She did not sail on a research cruise until the mid-1960s.
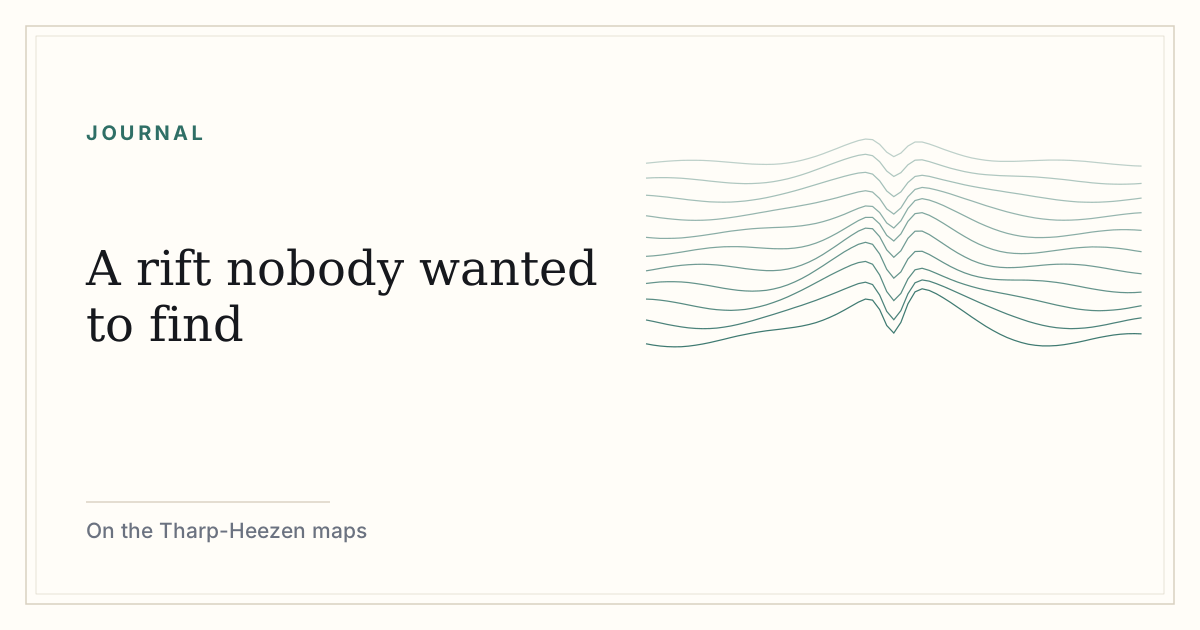
Around 1952, plotting six profiles across the North Atlantic side by side, she noticed the same feature in every one. The mid-ocean ridge, already known in outline, had a notch at its crest — a narrow, deep, V-shaped valley running along its axis. Not a local dent. It was in all of them, in the same relative position, on crossings hundreds of miles apart.
“Girl talk”
Heezen’s reported reaction, which Tharp recounted for the rest of her life, was to dismiss it as girl talk. The dismissal was not merely rude, and it is worth understanding why an intelligent colleague reacted that way, because it explains the whole episode.
A continuous rift valley along the crest of a mid-ocean ridge is very difficult to explain unless the seafloor is pulling apart. Pulling apart implies moving continents. Continental drift, proposed by Alfred Wegener before the First World War, was in the 1950s not an open question in American geology — it was a discredited one, the sort of thing that damaged careers. Tharp had not found an interesting bump. She had found the thing that everyone had already agreed was not there.
What settled it was an independent data set. Howard Foster, working in the same group, was plotting the epicentres of earthquakes recorded in the ocean basins. When Tharp’s rift and Foster’s earthquake belt were laid over each other, they coincided. The quakes were happening in the valley. Two unrelated instruments — a sounder measuring depth and a seismograph network measuring tremors — were pointing at the same line on the map. Heezen stopped arguing.
Tharp and Heezen published “physiographic diagrams”: oblique, shaded, almost hand-drawn views of the seafloor as though the water had been removed, rather than conventional contour charts. Part of the reason was communicative — the shape is legible instantly. Part of it was that detailed bathymetric contours of the ocean floor had military value and were restricted. A perspective sketch conveyed the geology without publishing a navigable depth chart.
The map as an argument
The first physiographic diagram of the North Atlantic appeared in 1957 under both their names. Harry Hess put forward seafloor spreading around 1960–62, and the rift valley became its most visible evidence: new crust forming at the ridge, splitting along the axis, spreading outward. The mechanism Wegener had lacked was now on a map that anyone could read.
The work culminated in 1977 with the World Ocean Floor panorama, painted with the Austrian landscape artist Heinrich Berann and published with support from the Office of Naval Research. It hung on classroom and government walls for a generation. Heezen died that year.
There is a story, often repeated, that Jacques Cousteau set out to disprove the rift, towed a camera along the ridge axis expecting to find nothing, and filmed the valley instead. We have not traced it to a primary source and flag it as a well-travelled anecdote rather than an established fact.
Credit, and how long it took
Tharp’s name is on the 1957 diagram and on the later maps. Her role in the identification of the rift — the actual observation, made by her, from data she plotted — was for decades described as draftsmanship in service of Heezen’s insight. The recovery of that credit happened largely in the last years of her life and after her death in 2006.
It is tempting to file this as a straightforward story about a woman being written out, and that is part of it. But there is a second reason the credit slipped, and it is specific to cartography: we treat a map as a document rather than as a claim. A paper has authors and an argument. A map looks like a description of a thing that was already there. Tharp’s rift was not lying on the seabed waiting to be transcribed — it was a pattern that existed only once someone drew hundreds of unremarkable depth readings in a form where the pattern could appear.
That is why the record sits in this collection alongside Hooke’s plates and Cajal’s drawings. In all three cases the picture is doing the reasoning.
Sources and further reading
- Heezen, Bruce C. and Marie Tharp. Physiographic diagram of the North Atlantic, 1957. Published with the Geological Society of America. See our collection record, which notes the copyright position.
- Heezen, Bruce C. and Marie Tharp, with Heinrich Berann. World Ocean Floor. Office of Naval Research, 1977.
- Hess, Harry H. “History of Ocean Basins,” 1962.
- Wegener, Alfred. Die Entstehung der Kontinente und Ozeane, 1915.
- Tharp, Marie. Autobiographical recollections, including the “girl talk” account, given in interviews and in Lamont–Doherty published reminiscences.
How we source and check these essays · Spotted an error? lumingrade@gmail.com